Sunburst Charts
Lab Demo
The Sunburst Chart is a great way to visualize hierarchical data. You can generate one online for FREE here.
The Sunburst Chart is a great way to visualize hierarchical data. You can generate one online for FREE here.
The Sunburst chart is a attractive, yet easy to understand, way to represent various traditional hierarchical data structures.
Below are some commonly found examples, including sample files that you may download to get an idea of the simple data format (in a tab-delimited text file) needed by this FREE charting service.
Once you know that, go ahead and generate your own charts. Resulting charts can be downloaded in either SVG or PNG format.
To generate a sunburst chart, you can either select one of the predefined JSON structures from the dropdownlist or upload your own JSON structure by clicking the "Upload a JSON file" button.
(Please note that while the sunburst chart is supported by most modern browsers, due to the technology it uses - it is not available on Internet Explorer 8 or older versions).
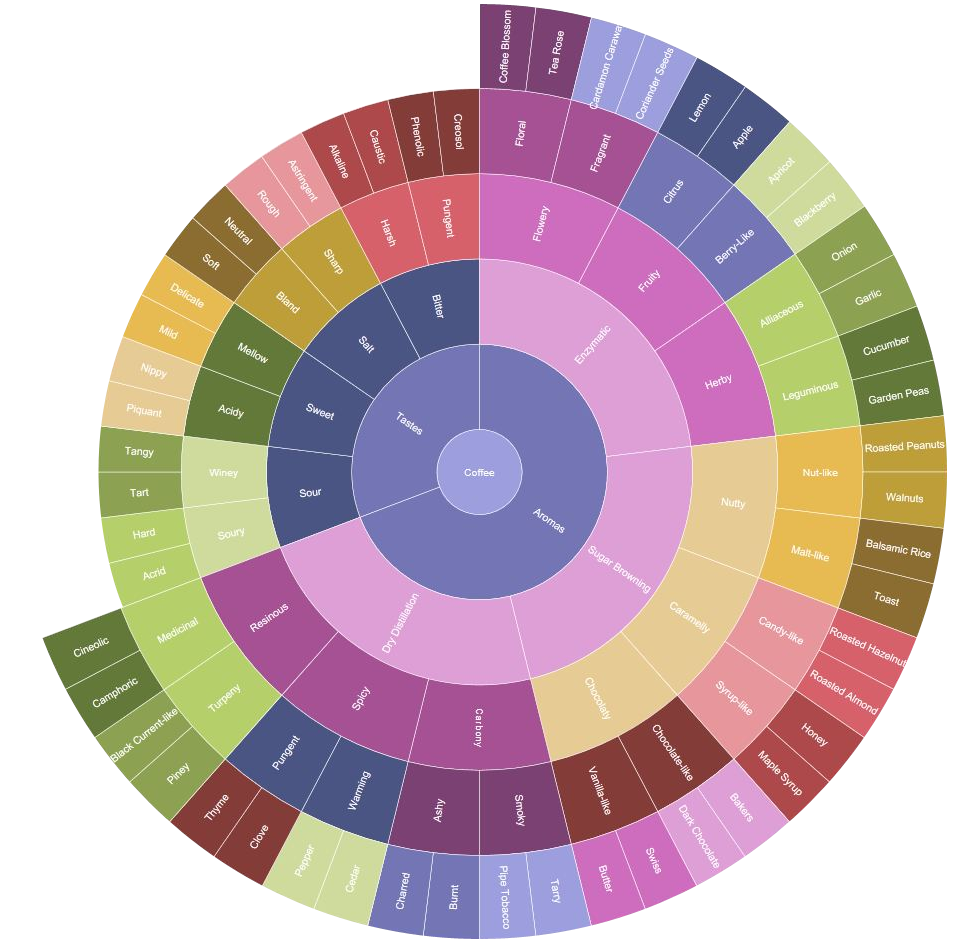
Coffee Flavor Wheel
This is a flavor wheel based on information from the original Coffee Taster's Flavor Wheel created in 1997 by the Speciality Coffee Association of America, the Colombian Coffee Federation, and Jean Lenoir. Read more about it in Roast Magazine. |
Wine Tasting Wheel
Based on information sourced from aromaster.com, this chart is designed to assist you in the identification of the bouquet and aromas in your wine. |
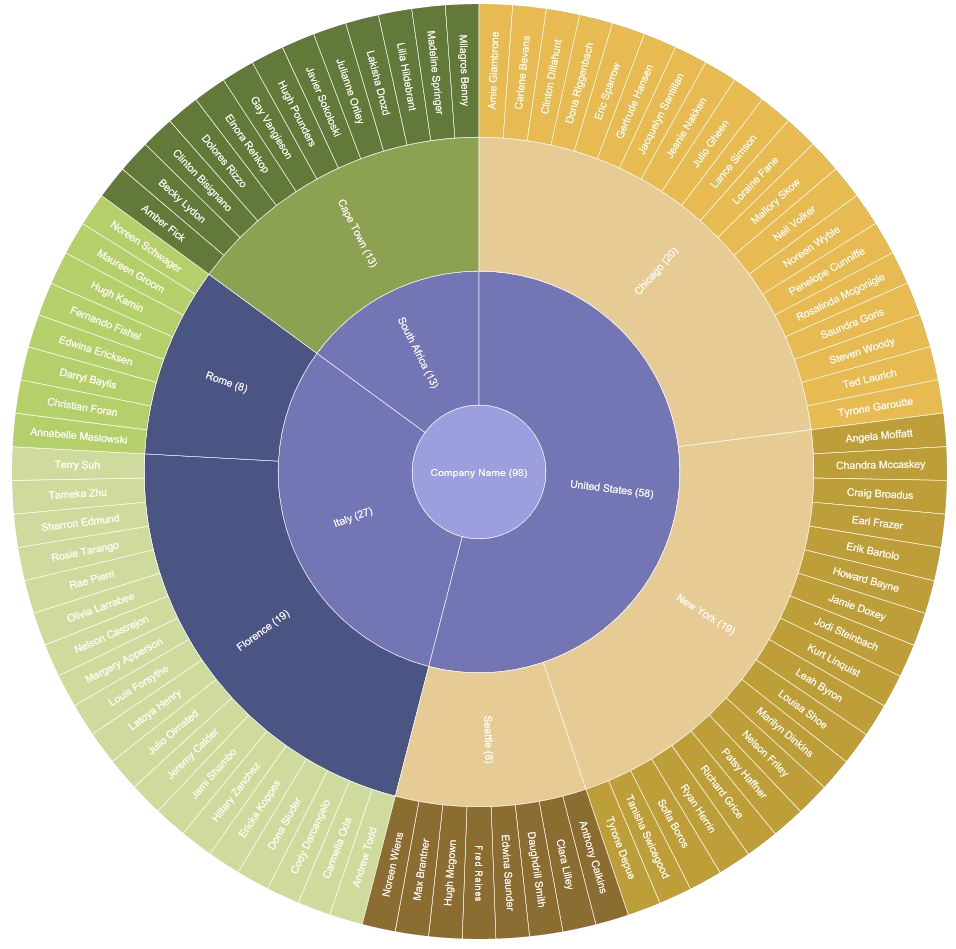
Headcount by Office Location
Distribution of staff amongst various offices can be easily determined from the chart shown here. |